Clustering analysis of SDA results
After a docking simulation (or an association rate simulation where the complexes are recorded), the complexes file
contains the most energetically favorable docked positions. There are typically between 500 and, when using solute flexibility, up to 20,000 entries
in this file. Using a clustering method allows these docking positions to be grouped into a few (3 to 10) representative clusters that are meaningful for analysis.
Different methods of clustering are available in SDA:
- New clustering method
clust2 allows for various clustering methods (average-linkage, centroid etc) and is much faster than the prevous method (next section). - An average-linkage algorithm, applicable to solute-solute interactions with output described here This method is now replaced by a newer clustering tool (see previous section). However, it can still be compiled and used, but is not available by default.
- A k-Means algorithm
- Additionally, a python script is provided for the specific case of a solute-surface simulation. This script moves all docking positions at the surface to one spot on the surface. This is required since the docking poses at different positions of the surface are equivalent if the surface has an atomically repeating structure.
Tool : auxi/clust2/clust
This clustering tool is based on the software available also for clustering gene expression data from the Human Genome Center, Institute of Medical Sciences of the University of Tokyo.
It allows to cluster by various methods (average or centroid linkage) and is much faster than the previous method. Using the script auxi/clust2/run_clustering.sh, it can be used in the same way as the old clustering tool.
As opposed to the old clustering tool, the complexes file does not need a reformatting. But it does require to be in ASCII notation as opposed to binary format.
This conversion is done by the wrapper script (auxi/clust2/run_clustering.sh) automatically. The tool itself is described in the README available in the clust2 directory. The wrapper script takes the following arguments:
run_clustering.sh
The last argument is the clustering method. If omited default 'a' is used
a - average linkage method
s - single linkage method
m - maximum linkage method
c - centroid linkage method
Most useful for SDA docking results etc. are average or centroid linkage method
Tool : auxi/clust
This clustering tool allows the clustering of docking positions using a hierarchical agglomerative average-linkage clustering algorithm. For this, the backbone RMSDs of all docked structures against each other are calculated. Please note, with this method, two structures with identical centers but different orientations can have large RMSDs.
The algorithm starts with each docking result representing its own cluster. At each step, the algorithm merges structures in clusters based on the average linkage distance (distance between the centers of clusters). Once the given number of clusters is reached, representatives of these clusters are written. These representative structures are chosen based on the closest distance to the center of the corresponding cluster.
All options are described in the pdf documentation
A typical usage of this clustering in SDA:
	# generate a complexes file suitable for the clust program

	read_record complexes -format_cluster


	# prepare cluster.dat file

	bin/clust -cl -n 2000 -f55 complexes.comp_cluster -p1 p1.pdb -p2 p2.pdb

	# make pdb files for the representatives of the 7 most populated clusters

	bin/clust -re -clcl 7 -f55 fort.55 -p1 p1.pdb -p2 p2.pdb

	# prepare score file

	bin/clust -sc -f55 complexes.comp_cluster -p1 p1.pdb -p2 p2.pdb

	# make energy analysis and generate pdbs for the 7 most populated clusters

	bin/clust -an -p -clcl 7 -f55 complexes.comp_cluster -p1 p1.pdb -p2 p2.pdb > cluster-out-info-2000
The final number of clusters is given as input to the clust program. The default value is set to 5, but it might be useful to adapt this value. In general, no correct number of final clusters exists and by decreasing the final number of clusters the loss of information increases. Therefore, an appropriate cluster number should balance between information gain and loss. We provide a tool called 'plot_cycles.py' in the auxi/clustering/programs/clust/aux/ directory. Using this (see below), you can plot the shortest distance between two clusters depending on the number of clusters in a given cycle (red line). Also plotted is the percentage distance increase relative to the shortest distance of the clustering step before (blue circles). This plot helps to find the clustering step where two clusters are merged that are quite distant and should not be merged to avoid too much loss of information. This clustering step can be identified by looking for a kink in the red curve. This analysis method is limited, as it only takes the shortest distance between two clusters into account. The RMSD variance in each cluster, the cluster sizes, and the total number of complexes are not considered.
An example can be found in the examples/bnbs/docking directory. In this Barnase/Barstar example, there is a kink when seven clusters are generated, but there is, for example, also a kink when 13 clusters are generated. This shows that the number of clusters depends on the required accuracy and the details of the project.
Afterwards, it is possible to adapt the number of clusters in the run_clusterDPipe.sh (found in the examples/bnbs/bnbs_docking example) script by changing the N2 value or by adjusting the -clcl option in the clust program.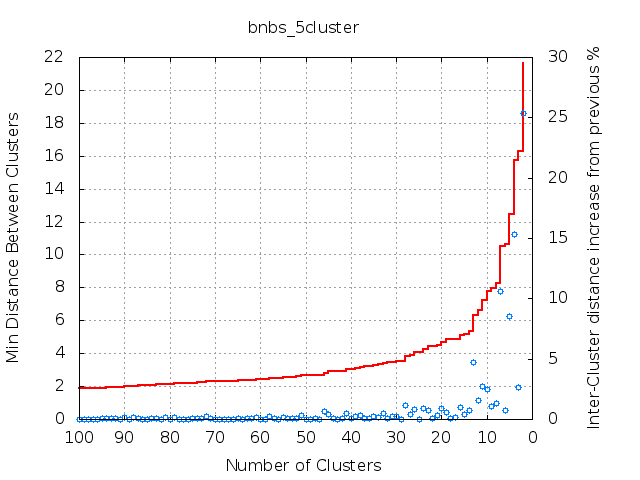
To run 'plot_cycles.py' it is necessary to run the clust program with the following command first:


USAGE: ./clust -an -p -cy > cluster_formation.out


The outputfile can then be used as input for 'plot_cycles.py':


USAGE: ./plot_cycles.py title inputFile outputFile


Where 'title' is the general title for the plot, the 'inputFile' is the outputfile of the cluster analysis
(generated when applying the options '-an -p -cy', 'cluster_formation.out' from above). The 'outputFile'
is the name for the *png image file.
A complete documentation, containing all options is available as pdf.
The recompilation of the clust program can be done in the src directory by calling make clust
All programs provide a summary in a similar format.
The table shows the output of the docking simulation from the barnase-barstar example
generated with the auxi/clust tool.
It describes the 5 final clusters classed by their cluster size (ClSize, the number of the members in each cluster):
 No  ClSize ClFSize    Repr    ReprE     ClAE    CLAED  RepRMSD  CLFRMSD      ElE   ElDesE   HyDesE      LjE   spread
  1     236   67370      35  -22.585  -22.289    0.555    4.965    5.052  -12.978    7.925  -17.532    0.000    1.380
  2      92    7759     301  -20.819  -20.774    0.907   16.251   16.121  -12.005    6.764  -15.578    0.000    1.749
  3      88   11624     304  -20.771  -21.390    1.045   13.867   13.984  -12.029    6.861  -15.603    0.000    1.129
  4      80    8890     230  -21.181  -21.696    0.729    3.370    3.479  -14.342    8.823  -15.662    0.000    1.558
  5       4     159     459  -19.340  -19.400    0.145   18.567   18.675   -9.798    6.046  -15.588    0.000    0.801

Distance between the chosen representatives of the clusters listed:

        complex_35      complex_301     complex_304     complex_230     complex_459
complex_35      0       13.3751 10.9781 3.40311 16.8218
complex_301     13.3751 0       3.86128 14.8969 7.1714
complex_304     10.9781 3.86128 0       12.5002 8.52078
complex_230     3.40311 14.8969 12.5002 0       17.83
complex_459     16.8218 7.1714  8.52078 17.83   0

Description of columns
No:        Cluster Number
ClSize:    Number of entries in the complexes (f55) file used in the cluster
ClFSize:   Number of representative entries for the cluster
Repr:      Representative chosen (corresponds to linenumber in the complexes, f55 file)
ReprE:     Total interaction energy of the chosen Representative
ClAE:      Average total energy of all cluster members weighted with number of representatives.
CLAED:     Weighted standard deviation of total energy of cluster entries in the complexes (f55) file
RepRMSD:   RMSD of the representative to solute 2
CLFRMSD:   Average RMSD of the cluster to solute 2
Ele:       Electrostatic energy
ElDesE:    Electrostatic desolvation energy of the representative complex
HyDesE:    Hydrophobic desolvation energy of the representative complex
LjE:       Lennard-Jones energy of the representative complex
spread:	   arithmetic average of rmsd's of each cluster member from the representative, weighted by occupancy
The clust tool also creates a file containing a matrix of all distances between complexes and for each cluster a list of the details of the cluster members.
Tool : auxi/k-means.py
As an alternative to the average- and single-linkage hierarchical clustering methods,
the k-means algorithm can be used for the clustering of the
docked complexes. The k-means algorithm consists of four major steps:
(1) initialization
(2) member assignment
(3) cluster center update
(4) convergence
The initialization step is the most important step in the k-means clustering
method, since the results will strongly depend on the initial selection
of the cluster centers. In our implementation, the Forgy method, which
assigns k random cluster centers, was used as an initialization method.
Based on the initial cluster centers, each member in the data set will
be assigned to the cluster of the closest center. In the third step,
the cluster centers will be updated and the members that are closest to
the geometric center of their corresponding cluster will be chosen as
new cluster centers. The second and the third steps will be repeated
until all the clusters converge.
The clustering program should be run several times with different starting conditions in order to obtain reasonably small spreads for each cluster.
USAGE:
	# generate a complexes file suitable for the clust program

	read_record complexes -format_cluster


	# suppress the rotation around the z axis for the first 2000 complexes( see below)

	auxi/DelRotZ_complexes-SDA7.py complexes.comp_cluster 2000


	# cluster with the k-means algorithm and generate the pdb files

	k-means.py -pdb p2.pdb -comp complexes.comp_cluster -cln 7
Options:
-atom : 'ca', 'bb', 'aa' (Atom selection for the calculation of RMSD. Ca, backbone and all-atom selections are available)
-rmat : rmsd_matrix.dat (RMSD matrix file can be used as an input)
-cln : # (Number of clusters requested)
-seed : # (Seed for the Python random number generator)
-h : (Prints out the usage and help menu)
Tool : auxi/DelRotZ_complexes-SDA7.py
In the case of a uniform and planar surface (which needs to be in the xy-plane), the translation along the plane and the rotation around the z-axis are irrelevant. To be able to use one of the previous algorithms optimally, this tool will translate all entries in the complexes file to the center of the surface, and rotate the solute about the z-axis so that its x-axis always points in the same direction.
Usage : auxi/DelRotZ_complexes-SDA7.py complexes n
where n indicates that the first n (number) entries in the complexes file will be considered.